Pump curve not only serve as a guide for engineers when designing fluid transport solutions, but also provide information for users to perform preventive maintenance on pumps.
This article explains centrifugal pump curves and discusses how to read and use them. If you want a thorough understanding of centrifugal pump curves, please read this article.
What Is A Centrifugal Pump Curve?
The pump curve charts is a curve that represents the relationship between the various performance parameters of the pump, it shows the performance and working status of the water pump under different conditions.
Pump performance curve chart contains the following information:
🔸Pump Head
🔸Flow Rate
🔸NPSH (Net Positive Suction Head)
🔸Impeller Size and Pump Performance
🔸Pump Efficiency Curve
🔸RPM (Revolutions Per Minute)
🔸BEP (Best Efficiency Point)
The centrifugal pump curve is not only an important tool for pump selection, but also a reference in maintenance work to check whether the status of various operating points of the pump deviates from the values recommended by the pump characteristic curve.
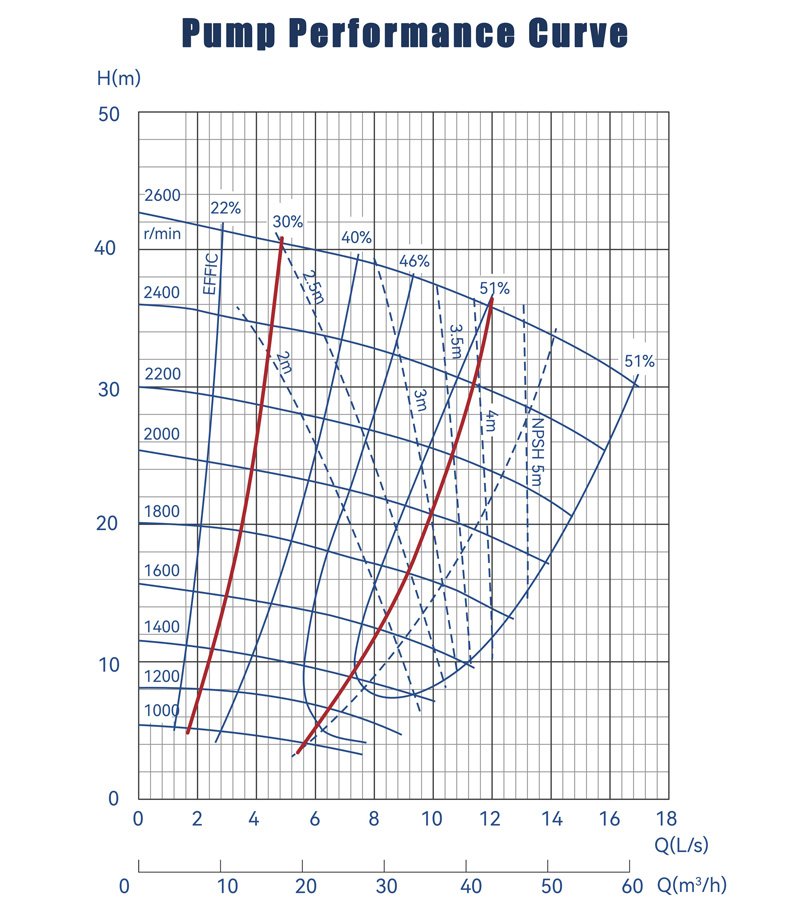
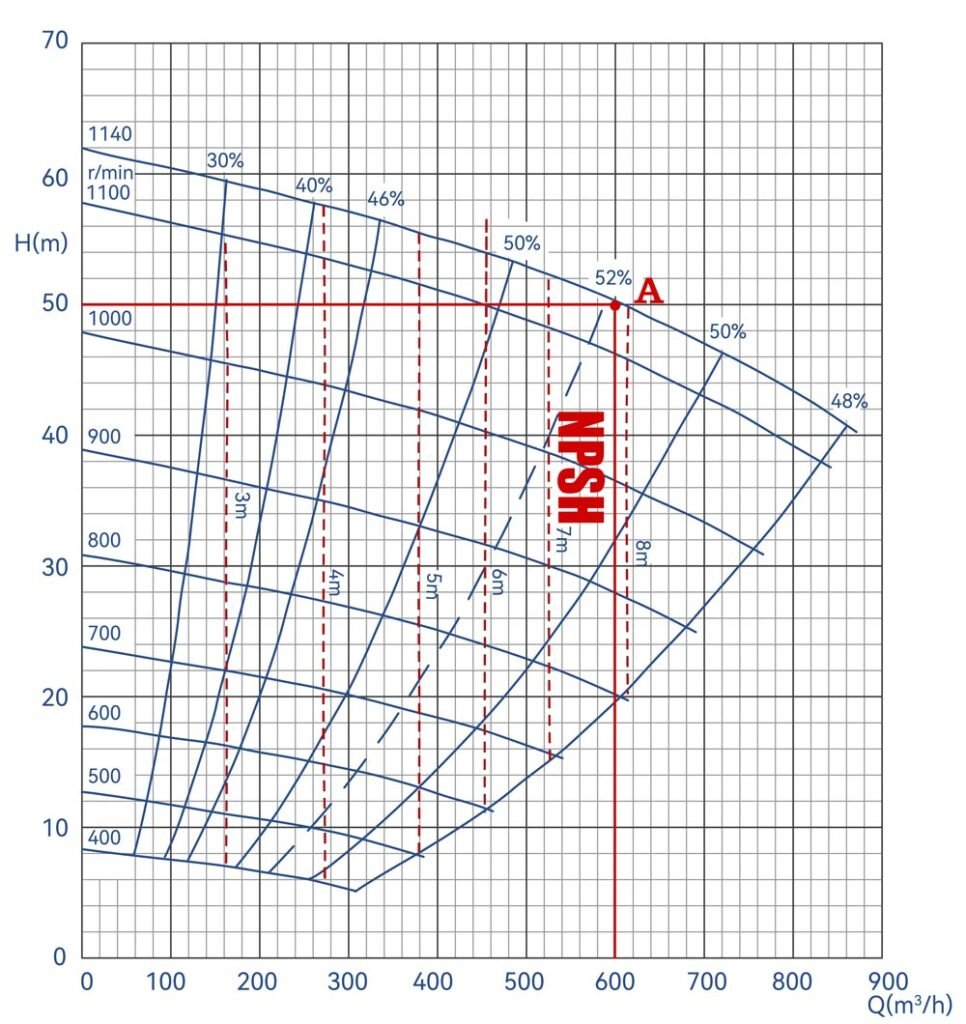
Fig. The Y-axis represents head in meters, and the X-axis represents flow rate in m³/h, or L/s.
The red line represents the pump’s optimal efficiency range, where the pump achieves high efficiency and minimizes wear.
How to Read A Pump Performance Curve?
Engineers usually use pump performance curves to make initial pump selections. By using the information on the pump curve, such as pump head and flow rate, and their intersection, we can roughly select the pump model.
If you want to understand the pump performance curve, you must first understand the various performance parameters of the pump. Please continue reading the following content to help you thoroughly understand the pump performance curve.
1. Pump Head
The Y-axis of the pump curve represents pump head, which represents the height to which a pump can pump liquid. Simply put, it’s the vertical distance between the pump outlet and the final pumping height. In actual calculations, factors such as elbow losses and pipe friction must also be considered.
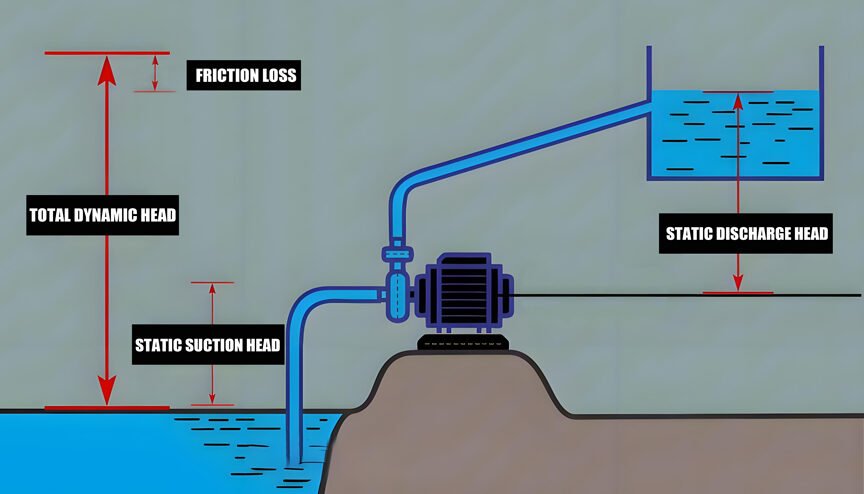
The following is a more detailed explanation of pump head, Total Dynamic Head.
Total Dynamic Head
What is TDH in Pump Curve? To put it simply, we usually use the Y-axis of the pump curve to represent TDH. The total dynamic head of the pump is the sum of the static lift, pressure head, power head, friction loss and other factors of the pump. It can be understood as the height to which the pump can lift the fluid after considering the above factors. It is usually expressed in meters or inches.
How to Calculate Total Dynamic Head?
TDH = Static Lift + Pressure Head + Velocity Head + Friction Loss
- Static Lift: Static lift refers to the height difference between the pump suction port and the liquid surface when the pump is stationary.
- Pressure Head: The pressure head is the static pressure provided by the fluid. That is to say, it refers to the head formed by the pressure of the fluid in the pipeline. Different pressure heads will be generated at the suction and discharge ends of the pump. The greater the pressure of the fluid, the greater the pressure head.
- Velocity Head: Velocity head is the height to which the kinetic energy of the fluid lifts the fluid during its flow. The greater the velocity of the fluid, the greater the velocity head.
- Friction Loss: Friction loss is the energy loss generated in the elbows, valves and pipes of the pipeline when the pump is transporting fluid.
Total Dynamic Head Formula
TDH=H static + H pressure + H velocity + H friction

2. Flow Rate
The X-axis of the pump performance curve represents the flow rate, which can be understood as the volume of fluid that the pump can deliver per unit time. It is usually expressed in cubic meters per hour (m³/h) or liters per second (L/s).
3. Pump Curve Best Efficiency Point
The pump has the highest efficiency and the lowest wear under this operating state .
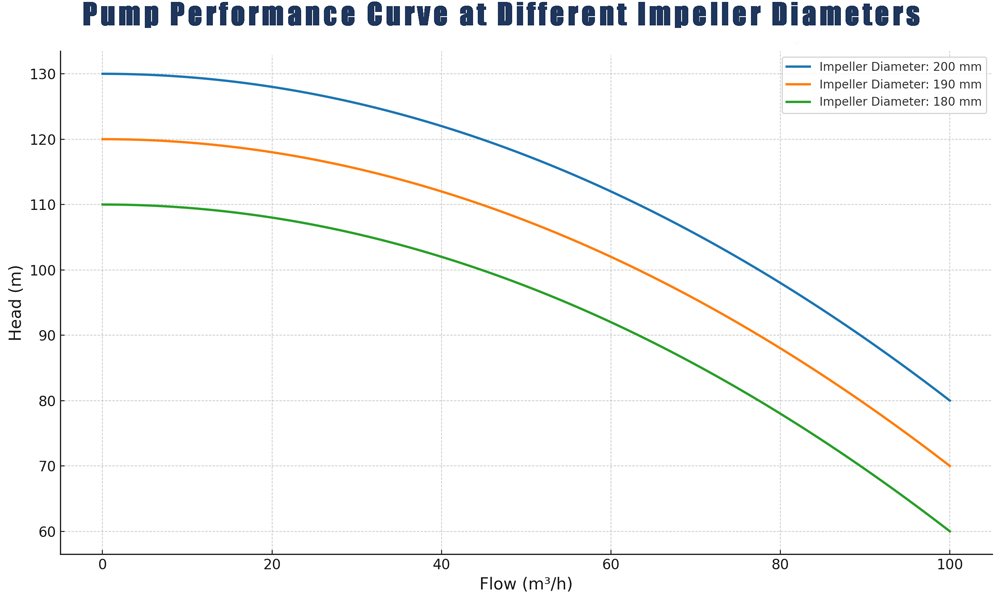
4. Impeller Size and Pump Performance
Impeller size affects pump performance. Increasing the impeller size increases the pump’s flow rate because a larger impeller can push more liquid. According to the affinity law: H ∝ D², where D is the impeller diameter, increasing the impeller size also increases the pump’s head.
However, it’s important to consider that simply increasing the impeller size doesn’t necessarily improve efficiency. A larger impeller requires a higher-powered motor to maintain rotation. You need to find the optimal efficiency point on the pump curve.
5. Pump Efficiency Curve
The pump efficiency curve is crucial in pump analysis because it tells us how efficiently a pump operates under different conditions—that is, how much of the motor’s input power is used to move liquid.
The pump efficiency curve also helps us identify the BEP (Best Efficiency Point) and the high efficiency range. The BEP or high efficiency range is where a pump achieves maximum performance and minimizes wear.
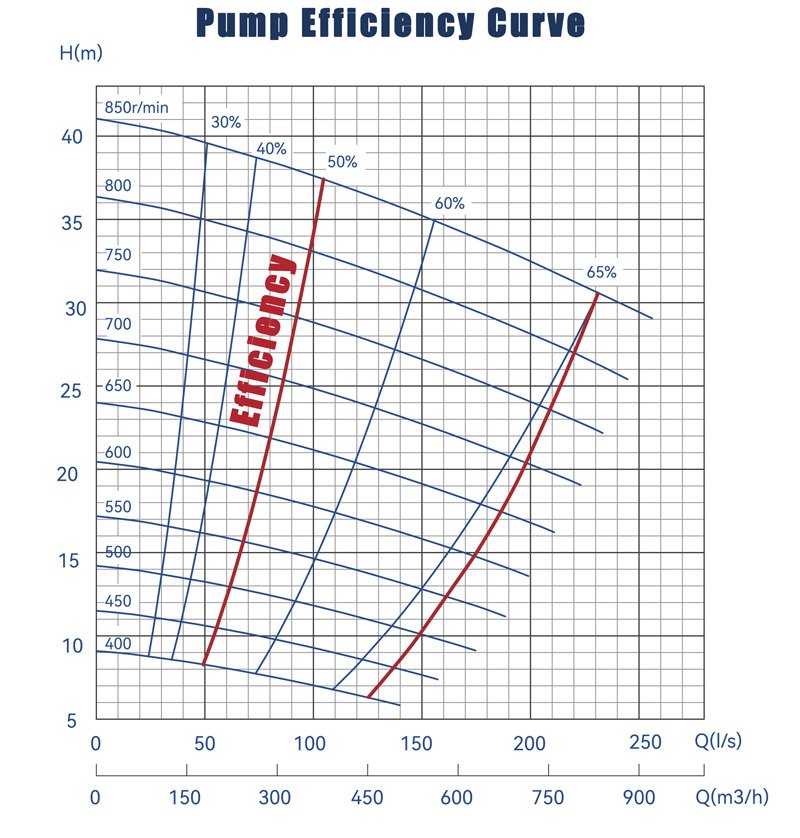
6. RPM
The speed of the pump has a significant impact on the head and flow rate during actual operation. The speed at the best efficiency point should be considered when selecting a pump.
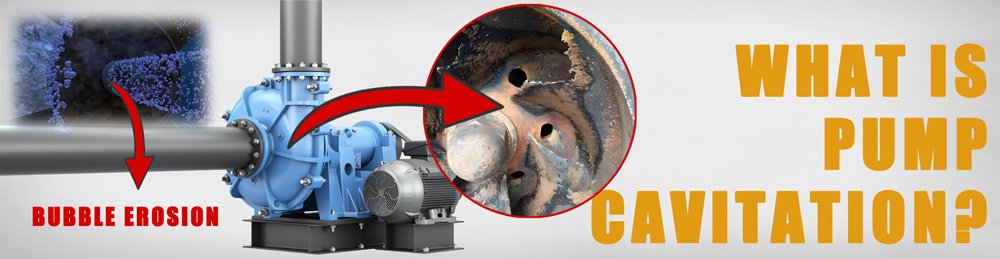
7. NPSH
Net Positive Suction Head is an important indicator for preventing cavitation during pump operation. NPSH has two parameters.
- NPSH A: The NPSH required for the pump in actual operation.
- NPSH R: The minimum NPSH required for the pump to operate.
When designing a pump delivery solution, NPSH A > NPSH R must be metto ensure that there is sufficient pressure at the pump suction end to prevent cavitation from occurring in the pump.
How to Read NPSH on Pump Curve?
On a pump curve, NPSH is the dashed line perpendicular to the X-axis.
We can see that different positions have different NPSH values. In the above content, we have mentioned that NPSH includes NPSH A (NPSH actually required during operation) and NPSH R (minimum NPSH required for operation). Please note that NPSH A > NPSH R must be ensured to ensure that cavitation does not occur in the pump.
We have determined the location of point A, and we can see that point A is near the range of NPSH R of 8m. So we can determine that when designing the pump delivery system, we must ensure that NPSH A >8m to better prevent cavitation.
Although the pump curves provided by each pump manufacturer are not exactly the same, if you can understand the meaning of the various parameters in the pump performance curve, you can make simple pump selection based on the pump curves provided by the manufacturer .
How to use the Pump Selection Curve?
With the above explanation, everyone has a basic understanding of pump curves. Now, we can use them to select pump models.
- Using the required flow rate and head data, we determine the pump’s operating point.
- The best efficiency point (BEP) is found near the operating point.
- The BEP allows us to determine the optimal motor power from the pump curve.
Expert Tips:
💡 When selecting a pump, try to choose one at or near the BEP to ensure it falls within the high efficiency range and maximize its service life.
💡 Using the pump curves provided by pump manufacturers, we can perform maintenance on existing pumps. For example, based on the pump’s BEP, we can adjust the impeller size or modify the piping and elbows to minimize wear and improve efficiency.
Specific Gravity & Viscosity Impact On Pump
1. How Does A Pump Curve Change With Specific Gravity?
The specific gravity of the fluid affects the pump power. The greater the specific gravity, the more power the pump consumes.
According to the relationship between the specific gravity and density of a fluid, the greater the specific gravity of the fluid, the greater the density. When the density of the fluid increases, the resistance of the pump system to transport the fluid becomes greater, and the pump system requires more power to transport the fluid.
When a pump delivers a fluid with a greater specific gravity than expected, it will increase the power consumption of the pump, make the pump flow unstable, accelerate wear, and reduce the efficiency and service life of the pump system.
2. Effect of Viscosity on Pump Performance
The change of fluid viscosity will affect the power, flow rate and head of the pump. When the viscosity of the fluid increases, the flow rate will decrease, and the power and head will increase.
When the viscosity of the fluid transported by the pump increases, the resistance to the flow of the fluid in the pipeline will increase, the fluidity of the fluid will decrease, and the flow rate will decrease accordingly. In order to maintain the same flow rate, the pump system needs to increase power, which will cause the pump to consume more energy.
When the viscosity of the fluid increases, the flow resistance of the fluid in the pipeline increases. In order to overcome these resistances, the pump system requires greater force (head) to transport the fluid, which will cause the pump head to increase.
So we can conclude that when the viscosity of the fluid increases, the pump requires more power to transport the fluid, resulting in a decrease in flow rate, an increase in pump power, and a decrease in pump efficiency.
Conclusion
In short, the pump curve can provide very important data during pump selection and maintenance. Based on data such as flow rate, head, and power, we can determine the efficient operating range of the pump and make the correct selection or optimal maintenance to maximize efficiency.
Frequently Asked Questions
Positive Displacement Pump Curve
Positive displacement pumps rely on periodic changes in the volume inside the pump to deliver fluid, so in the positive displacement pump curve, the flow rate does not change with pressure.
In a positive displacement pump graph, the flow vs. pressure characteristic curve is almost horizontal.
Pump Curve Power Vs Flow Rate
The power of the pump increases exponentially with the increase in flow rate.
When the flow rate increases, the fluid will produce greater resistance in the pipe, and the pump will need to increase more power to push the fluid.
How Does VFD Affect Pump Curve?
The VFD system can adjust the speed of the motor according to the load changes of the pump system, thereby changing the speed of the pump.
By adjusting the pump speed through the VFD system, the flow and head of the pump system can be accurately controlled, energy can be saved, unnecessary losses can be reduced, the pump can always maintain high-efficiency operation, the service life of the pump can be extended, and maintenance costs can be reduced.
Pump Curve and System Curve
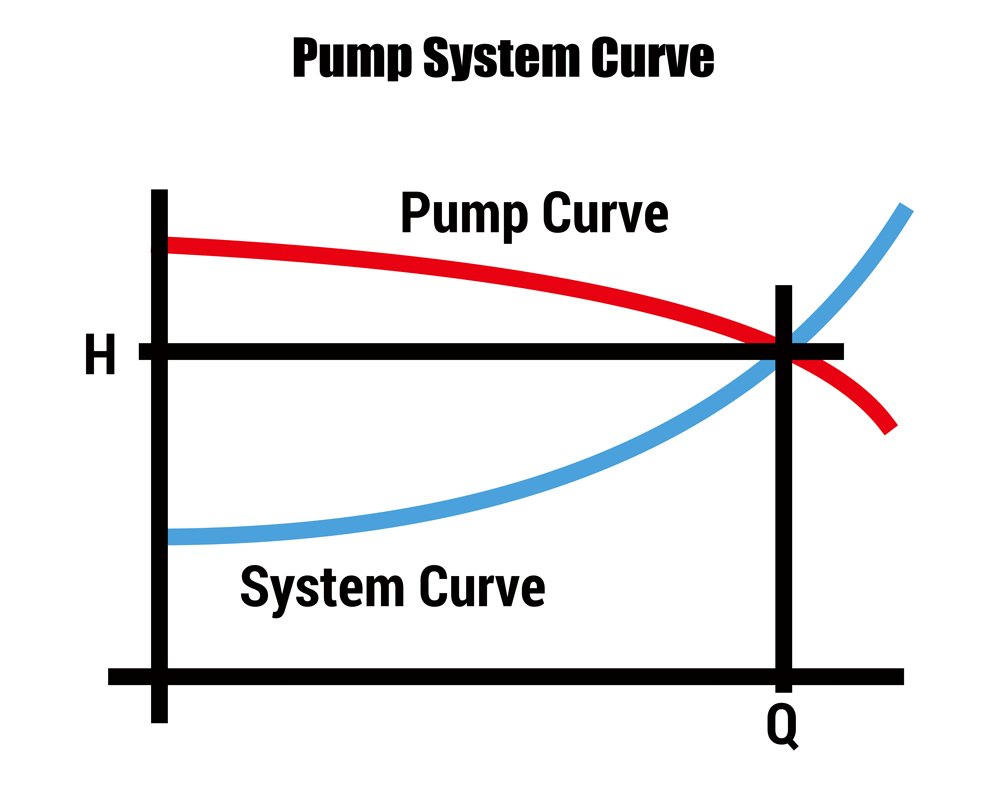
The pump system resistance curve shows the changes in resistance and flow rate that the entire pump system needs to overcome to push the fluid. These resistances include pipeline friction, bend loss, valve loss, etc.
In the pump system resistance curve, the pump curve gradually decreases with the increase of flow rate, and the pump system curve gradually increases with the increase of flow rate. The intersection of these two curves is the working point of the pump system. At this time, the head and resistance of the pump system are balanced, which is the optimal working point of the pump system.